The Problem
You can't protect what you can't see — or connect
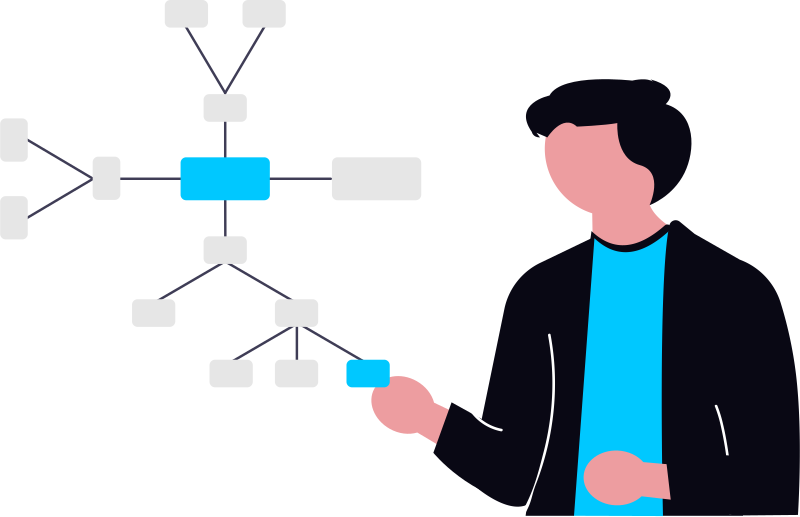
Asset inventories live in ten different consoles, spreadsheets and a CMDB that was stale the day it was built. Attackers, meanwhile, see one connected graph.
Fragmented inventories
Cloud consoles, K8s dashboards, SaaS admin panels, CMDBs — each holds a partial, conflicting view of what you actually run.
Stale the moment it's written
Manual asset registers and quarterly audits can't keep pace with ephemeral containers, autoscaling groups and AI services spun up in minutes.
Relationships are invisible
Knowing an S3 bucket exists isn't enough. Which identity can reach it? Which agent reads from it? Which app depends on it? Nobody knows.
Attack paths stay hidden
Breaches chain low-severity issues across layers. Without a graph, the chain from exposed key → role → database is invisible until it's exploited.
Suronex AssetGraph
A living map of your entire environment
AssetGraph continuously discovers, connects and scores every asset — so questions that took weeks take seconds.
Real-Time Unified Inventory
One continuously-updated inventory across every environment — no agents, no spreadsheets.
AI AssetsCloudKubernetesSaaSIdentitiesApplicationsContainersRelationship Mapping
Every asset connected to the identities, networks, data and workloads it touches — a queryable graph of your environment.
OwnershipDependenciesData FlowsNetwork ReachabilityAttack Path Analysis
Suronex chains misconfigurations, permissions and exposures to reveal exploitable paths to your crown jewels.
Path VisualisationChoke PointsBlast RadiusPrioritised FixesGraph Search
Ask questions in seconds: 'internet-exposed VMs with access to production data' or 'AI agents that can write to code repos'.
Natural QueriesSaved ViewsInstant AnswersBusiness Context
Tag assets by owner, environment and criticality — so risk scores reflect what actually matters to the business.
Auto-TaggingCriticalityOwnershipEnvironmentsDrift & Change Timeline
See what appeared, changed or vanished — with a full history for investigations and audits.
Change HistoryNew Asset AlertsForensic Timeline
Runtime Security
A graph that knows what's running right now
AssetGraph enriches every asset with runtime signals — live workloads, active network flows and real reachability — so the graph reflects what is actually running and communicating this minute, not what a config file says should be.
- Live Workload State
- Active Network Flows
- Runtime Reachability
- Real-Time Drift
Coverage & Integrations
What AssetGraph inventories
Agentless, API-based discovery across your full stack.
- Cloud Providers
 AWS
AWS Microsoft Azure
 Google Cloud
 Oracle Cloud
 Alibaba Cloud
- Runtime & Orchestration
 Kubernetes
 AKS
AKS EKS
EKS GKE
GKE OpenShift
- Containers
- Virtual Machines
- Serverless
- AI & Data
- AI Models
- AI Agents
 MCP Servers
- Vector DBs
- Databases
- Storage Buckets
- Data Warehouses
- SaaS & Identity
 Microsoft 365
 Google Workspace
 Salesforce
 GitHub
 Slack
Slack Okta
Okta Entra ID
- Service Accounts
FAQ
Frequently asked questions
How is AssetGraph different from a CMDB?
A CMDB is a manually-maintained database that describes what you think you have. AssetGraph is built automatically from live API data, refreshed continuously, and — critically — models the relationships between assets, which is what attack path analysis requires.
How quickly is a new asset discovered?
Assets are typically discovered within minutes of creation through continuous API polling and event-based triggers — including short-lived containers and AI services.
What is attack path analysis?
Suronex combines asset relationships with misconfigurations, vulnerabilities and permissions to compute realistic paths an attacker could take — for example, exposed workload → over-permissioned role → production database — and highlights the single choke point that breaks the chain.
Can I query the graph myself?
Yes. Graph Search lets you ask questions across every connected environment and save the results as live views — useful for security reviews, audits and incident response.
Does AssetGraph require agents?
No. Everything is discovered agentlessly through read-only API connections to your cloud, SaaS, identity and code platforms.
Keep Exploring